OBIEE 11g integration with Microsoft Analysis Services Cubes - Leveraging Statistical capabilities of Analysis Services -
How to use Cube Hierarchies and Statistical Functions together:
As we know, Microsoft Analysis Services has OLAP engine with strong statistical capabilities. Following figure shows the statistical functions available from Microsoft Analysis Services.
I got a question from my client - whether to use OBIEE engine for statistical analysis or do it via pushing to cube by way of MDX.
For those of you, who came directly to this post, some of my last posts discuss about pushing calculations to cube and it may be worth reading those posts.
I checked some statistical functions in OBIEE (I am still checking this), compared it to database functions, and came to know that OBIEE calculates them the same way as Oracle Database does. But my main concern was using the hierarchies with statistical functions.
Although, I was able to calculate statistical functions along with hierarchies by writing SQL code, it seems quite difficult to model in OBIEE.
Analysis Services has strong statistical capabilities and I tend to use them for my purpose.
Let's start with MEDIAN.
'Median' is an important measure of central tendency of a sample. I know that, everybody is aware about the definition of median, but just for the sake of completeness, I want to summarize it here:
Definition - Median:
The median is the value of the middle item of a set of items that has been sorted into ascending or descending order.
In an odd-numbered sample of n items, the median occupies the (n+1)/2 position. In an even-numbered sample, we define the median as the mean of the values of items occupying the n/2 and (n+2)/2 positions (the two middle terms).
In this post, I want to show the way to calculate median over a data set (product dimension and sales amounts) and how the other dimensions will affect the calculation.
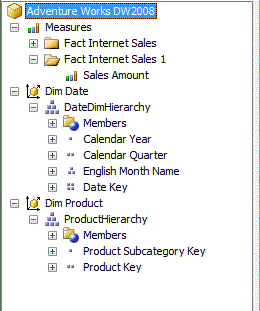
The cube is as shown below:
The cube has two dimensions -
1. Dim Date
2. Dim Product
Each of these dimensions has one hierarchy which can be seen in the adjacent figure.
The measure used to calculate the median is 'Sales Amount'.
Following is the logical model diagram, in OBIEE:
As you can see, its very simple model. Its just the cube measures, product and date dimensions.
The challenge here is to pass the cube hierarchies through the logical layer of OBIEE, and preserve the drill down for these hierarchies and statistical calculations at the same time.
This can be achieved by Fixing the currentmembers in those dimensions which we want to appear in the report and calculating the statistical function on the dimension we want.
In simple terms, we can start with fixing our currentmember to e.g. 'August 2002' and then calculate the median of Sales Amount over Product dimension. So I ask cube to first fix the currentmember to 'August 2002'. Then pick a member from Product dimension. And for the member which is picked from Product dimension, give me the median over all its children.
This can be achieved by the following expression:
evaluate_aggr('median({[Dim Date.DateDimHierarchy].currentmember* [Dim Product.ProductHierarchy].children}, [Measures].[Sales Amount])' as double)
You are free to use this in the formula tab of Answers, or in RPD.
Now let's have a look on the analysis - How our drill down and statistics work together:
I made a simple analysis with putting a filter on Month column, and including Month, Product, and other metrics in the report.
Following is the figure which shows the formula in the answers:
Following is the results:
The above figure shows data at the lowermost level. You can see the sales amount for each product.
The median over this sample should be (20714.20 + 18642.78)/2.
This can be seen in the figure below:
Now the median over product subcategory 1 and 2 should be (412207.41 + 133794.06)/2. Since we'll always calculate median over the sales amount at a particular level. There is not much use of calculating a median over a median.
This can be seen in the next figure:
So we saw, how we can preserve hierarchical relationships and statistical calculations together in the same analysis.
This is a simple scenario. Even complex situations can be achieved by using this approach.
Calculation of standard deviation is similar to median with the help of following expression:
evaluate_aggr('stddev({[Dim Date.DateDimHierarchy].currentmember* [Dim Product.ProductHierarchy].children}, [Measures].[Sales Amount])' as double)
Standard Deviation tells us - how much variation or "dispersion" there is from the "average", which is again very important measure to have an insight into the data.
Hope this post will be useful to readers. Comments appreciated. Thanks.


Very nice article.
ReplyDeleteHow can we achieve the same in 10.1.3.4?