I want to start this post with a simple view of a MSAS cube in Microsoft Business Intelligence Development Studio. My aim is to show different types of aggregations available, while building the cube.
Whenever a cube is built in MSAS, an aggregation rule (AggregateFunction) is assigned to the measure. This can be seen in the following figure:
The figure shows the structure of a very simple MSAS cube. The aggregation rule in this example is 'DistinctCount'.
This measure is actually a Customer Key column in the Fact Table in the Data Warehouse.
Different technologies have different ways to aggregate data. As you are already aware, that in OBIEE we put aggregation rule over a measure in the fact table (we can put different aggregation rules for different dimensions in OBIEE). Hyperion Essbase has a completely different way to handle the aggregations. It has capability to assign the aggregation operator to each member of its dimension. The comparison of aggregation strategies among various tools is the idea of a different post.
For those, who want to know the other possible aggregation rules available in MSAS, the following screenshot may be helpful:
The most common aggregation rule we encounter in our day to day interactions with BI and DW systems is 'Sum', which is pretty straightforward to handle.
Other frequently used Aggregation rules are Average, Min, Max etc.
Once the cube is built in the Microsoft BI Development Studio, its deployed, and then processed.
For OBIEE perspective, we'll not go to depth of these terms and their effects, but once a cube gets processed successfully, it contains the measure value for each of the possible combinations of its dimension members.
The best way to explore a cube, is either through Microsoft Excel, or through Microsoft SQL Server Management Studio, where you can drag and drop hierarchies, levels, and measures easily over the canvas.
If a measure in the cube is having aggregation rule 'Sum', then its perfectly possible to take day/month level data (e.g. product sales for day/month) in OBIEE, and aggregate rest of the levels e.g. Quarter/Year etc in OBIEE by putting an aggregation rule in fact measure.
But for measures like 'Customer Count' data needs to be provided by the cube. Its not possible for OBIEE to have day/month level data for 'Customer Count' and aggregate it to Quarter, year level, without having customer keys.
This is the reason for having 'External Aggregation' rule in OBIEE for COUNT DISTINCT measures. This is described in this post. I discussed the function shipping abilities too in the same post.
Now let's discuss the Custom Aggregations:
There are many types of Custom Aggregations. What I am going to discuss here is a special case i.e. CASE STATEMENTS.
Following is my Data Set:
The Customer Count for January 2003 is 244.
January 2004 is 1777.
and the Customer Count for January 2003 AND January 2004 is 1973 (due to overlapping customers), as can be seen below.
The job is to model this in OBIEE such that, I have two columns in the Report - Column1. CASE WHEN Month_name IN ('January 2003', 'January 2004') THEN 'January 2003/4' ELSE Month_name END
Column2. Customer Count.
This is pretty straightforward. Here are the steps:
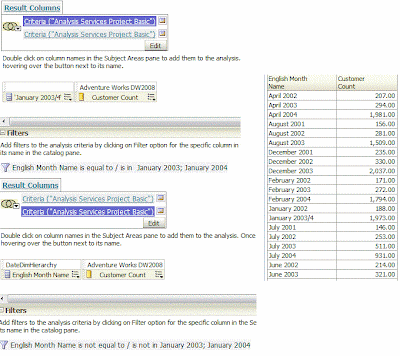
Step 1. Make an analysis with Month Name and customer count. Put a Filter on Month Name so that it contains only January 2003 and January 2004. Use Edit formula of Month Name column so that it contains a literal 'January 2003/4'
Step 2. Combined this analysis with similar analysis with different filter i.e. excluding January 2003 and January 2004
Here are the analyses and the results:
Results as expected.
Now the same question with a twist - I need to see Customer Count for the whole year 2003 and Month January 2004 as in One row, and rest of the months as usual.
So I need two columns in the report -
Column1 - CASE WHEN (Month Name = 'January 2004' AND Year = 2003) THEN 'Custom Selection' ELSE Month Name END
Column2 - Customer Count
Here is what exists in the cube (This is when I explored the cube from Microsoft Studio):
If I follow the same approach of putting filters, then its not going to give me any data, as shown below:
The reason its not giving me any data lies in MDX it generates, but at the moment I don't want to explore that way.
What I'm going to do is to Call MDX AGGREGATE function from OBIEE and pass it the parameters as below:
What I have done is to pass these two dimension members i.e. year 2003 and Month January 2004 to MDX AGGREGATE function, with a measure.
We need to set the aggregation rule over this column to 'Evaluate_Aggr' as below:
Otherwise its not going to pass the repository consistency check.
I created the report, and got the results as expected:
We can combine this with a similar request to show other months. It seems to work the way expected. We can even put other dimensions and measures in the analysis and it should work fine.
I hope this post would be useful to the readers. Comments appreciated. Thanks.


Thanks for the details information here, very helpful.
ReplyDelete